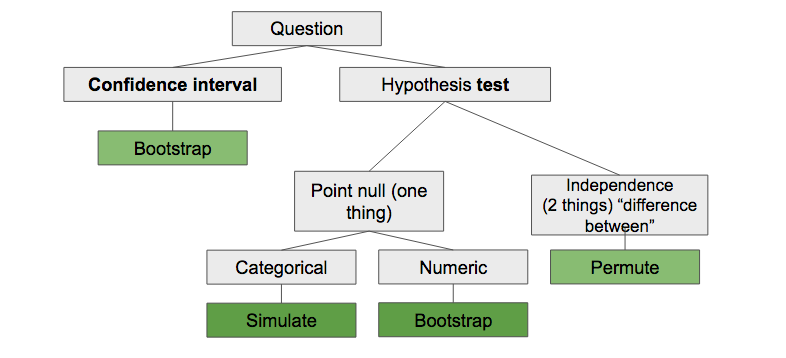
The goal of today’s homework is to practice statistical inference using simulation procedures. The data for today’s lab may be found by cloning your repository available at the class GitHub repository. Use the lecture notes, readings, and application exercises to help you complete the lab. You can also use this chart on simulation-based inference to help you determine the appropriate sampling scheme when conducting simulation-based inference.
The dataset is adapted from Little et al. (2007), and contains voice measurements from individuals both with and without Parkinson’s Disease (PD), a progressive neurological disorder that affects the motor system. The aim of Little et al.’s study was to examine whether they could diagnose PD by examining the spectral (sound-wave) properties of patients’ voices. This is the same data we saw in class.
147 measurements were taken from patients with PD, and 48 measurements were taken from healthy controls. For the purposes of this lab, you may assume that measurements are representative of the underlying populations (PD vs. healthy).
The variables in the dataset are as follows:
clip: ID of the recording numberjitter: a measure of variation in fundamental
frequencyshimmer: a measure of variation in amplitudehnr: a ratio of total components vs. noise in the voice
recordingstatus: PD vs. Healthyavg.f.q: 1, 2, or 3, corresponding to average vocal
fundamental frequency (1 = low, 2 = mid, 3 = high)You may load in the data with the following code, where
____ should be replaced by a meaningful name of your
choosing. Then be sure to remove the eval = FALSE:
library(tidyverse)
library(infer)
____ <- read_csv("data/parkinsons.csv")$\mu$ in the narrative. To write \(\mu_{H}\), type in $\mu_{H}$
in the narrative. To write \(\alpha\),
type in $\alpha$ in your narrative. To write \(\neq\), type in $\neq$ in your
narrative.
Is there enough evidence to suggest that the mean HNR in the voice recordings of the healthy patients is significantly different from 25 at the \(\alpha\) = 0.05 significance level?
Researchers suspect that patients with PD are less able to control their vocal muscles, and thus may have a different HNR (tonal component to noise ratio) compared to healthy volunteers. Thus, they are interested in whether the mean HNR in voice recordings among patients with PD is statistically significantly different from the mean HNR in voice recordings among healthy patients. The researchers select the 0.05 significance level.
Suppose we are now interested in testing whether a correlation exists between voice jitter and voice shimmer among healthy volunteers. Test whether the correlation between these two values is non-zero at the \(\alpha\) = 0.01 level.
As an aside, correlation is given in symbols by \(\rho\).
Hint:
Refer to HW 05 for what to specify(). Use
hypothesize(null = “independence”). The type of simulated
data we will generate() depends on two
quantities/variables; consult the chart.
Knit to PDF to create a PDF document. Knit and commit all remaining changes, and push your work to GitHub. Make sure all files are updated on your GitHub repo.
Please then upload your PDF document to Canvas.